
Compare time frames in reports
Details
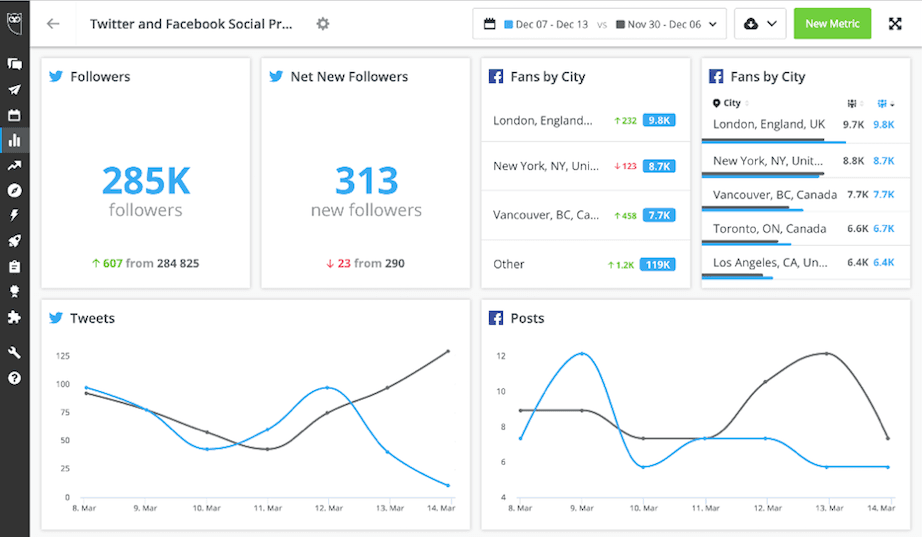
Analytics customers can now select two different time frames when editing report dates to compare performance across time periods. This lets customers measure campaign impact, identify trends, and visualize changes in performance year-over-year, month-over-month, or across a custom time frame.
To visualize data across two time frames, tiles must be configured to one of the following formats:
Line chart
Column chart
Number
List
Please complete the form to learn more
* indicates required fields
Related updates

Social OS: The First Operating System That Turns Live Social Signals into Business Action
Social OS brings social intelligence, publishing, customer care, and employee advocacy together in one AI-powered operating system, so you can move at the speed of culture.

Filter by approver in Planner
Filter by Approver in Planner gives you instant visibility into your approval pipeline so you can identify which posts are waiting on specific people and resolve bottlenecks without manual effort.

Improvements to Virtual Agent Integrator (VAI) in Inbox
We are adding VAI improvements to Hootsuite Inbox to give you precise control over which message types trigger automated responses

Unlock insights tailored to your business
Get your zero-risk trial to see how Hootsuite can power brand growth with the industry’s deepest insights.