New metrics and visualizations in Hootsuite Analytics reports
Details
We've added two new metrics in Analytics that use the new Heatmap visualization: Facebook Fans Online and Instagram Followers Online. These two metrics tell you how many fans or followers you had online at each hour of every day.
We've also redesigned two of our existing visualizations—the pie chart and geomap—adding new sizes that attach a list to the existing pie chart or geomap.
Please complete the form to learn more
* indicates required fields
Related updates

Social OS: The First Operating System That Turns Live Social Signals into Business Action
Social OS brings social intelligence, publishing, customer care, and employee advocacy together in one AI-powered operating system, so you can move at the speed of culture.
Filter by approver in Planner
Filter by Approver in Planner gives you instant visibility into your approval pipeline so you can identify which posts are waiting on specific people and resolve bottlenecks without manual effort.
Improvements to Virtual Agent Integrator (VAI) in Inbox
We are adding VAI improvements to Hootsuite Inbox to give you precise control over which message types trigger automated responses
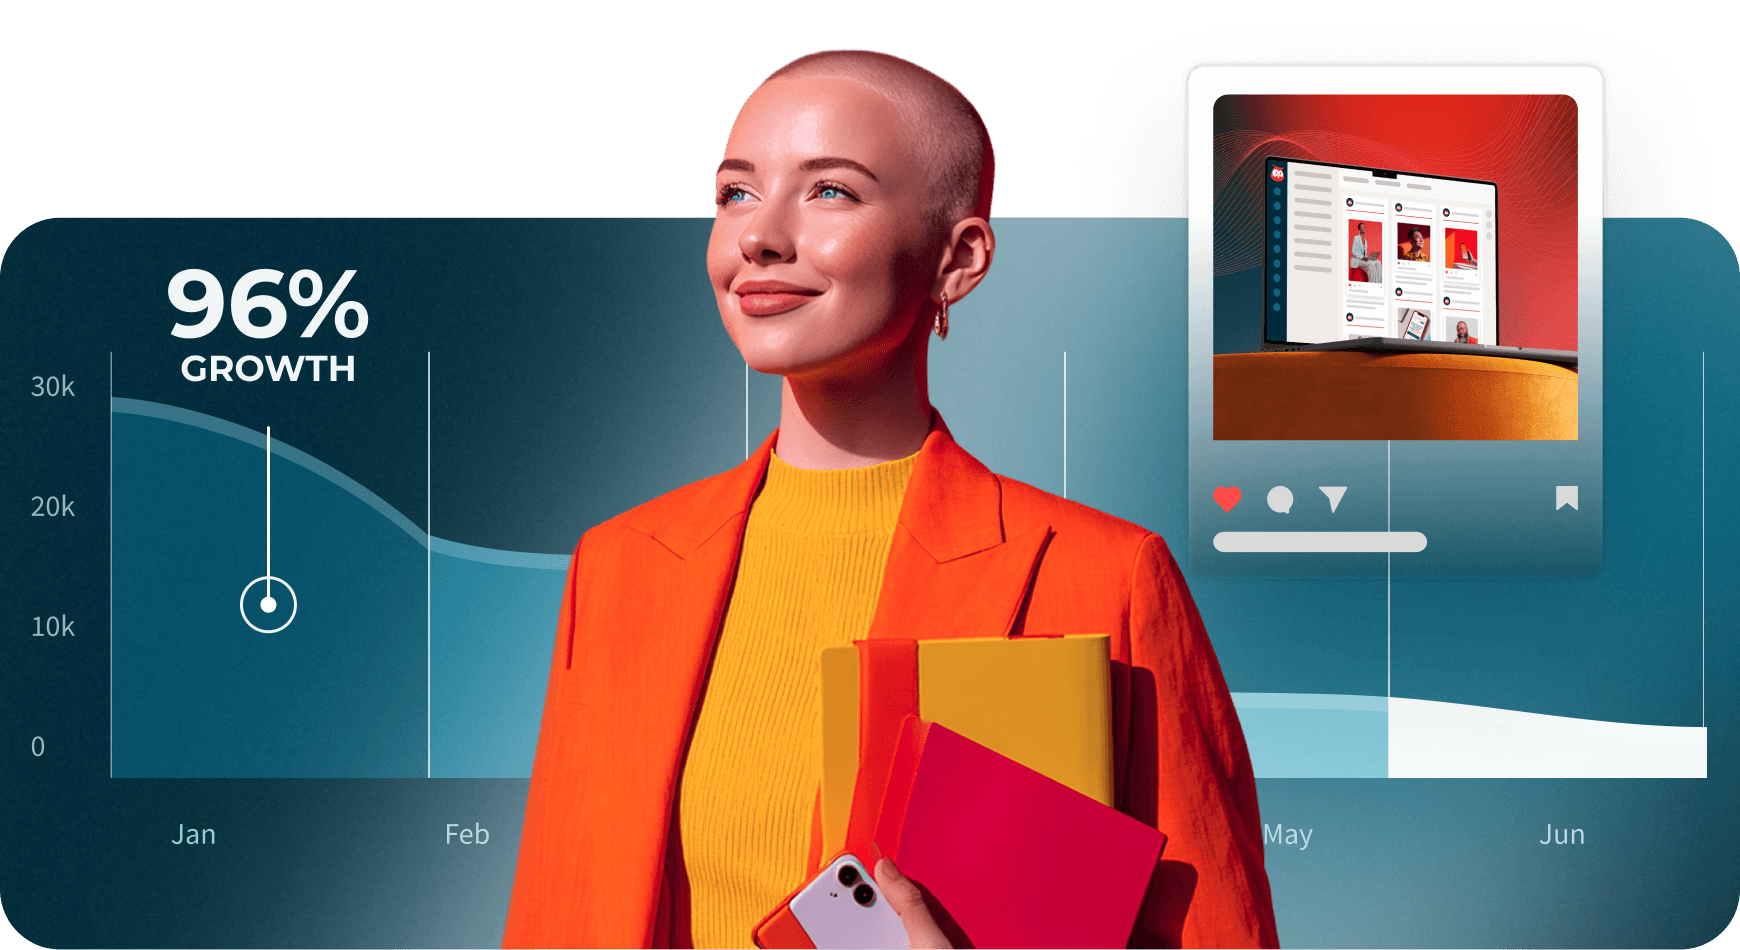
Unlock insights tailored to your business
Get your zero-risk trial to see how Hootsuite can power brand growth with the industry’s deepest insights.